TLDR
Key Metrics:
A production agent requires constant iteration. You get it working, then you watch it and look for ways to optimize it. First in testing, then in front of real traffic. The key to all of this seeing inside the runs to know what exactly your agent is doing.
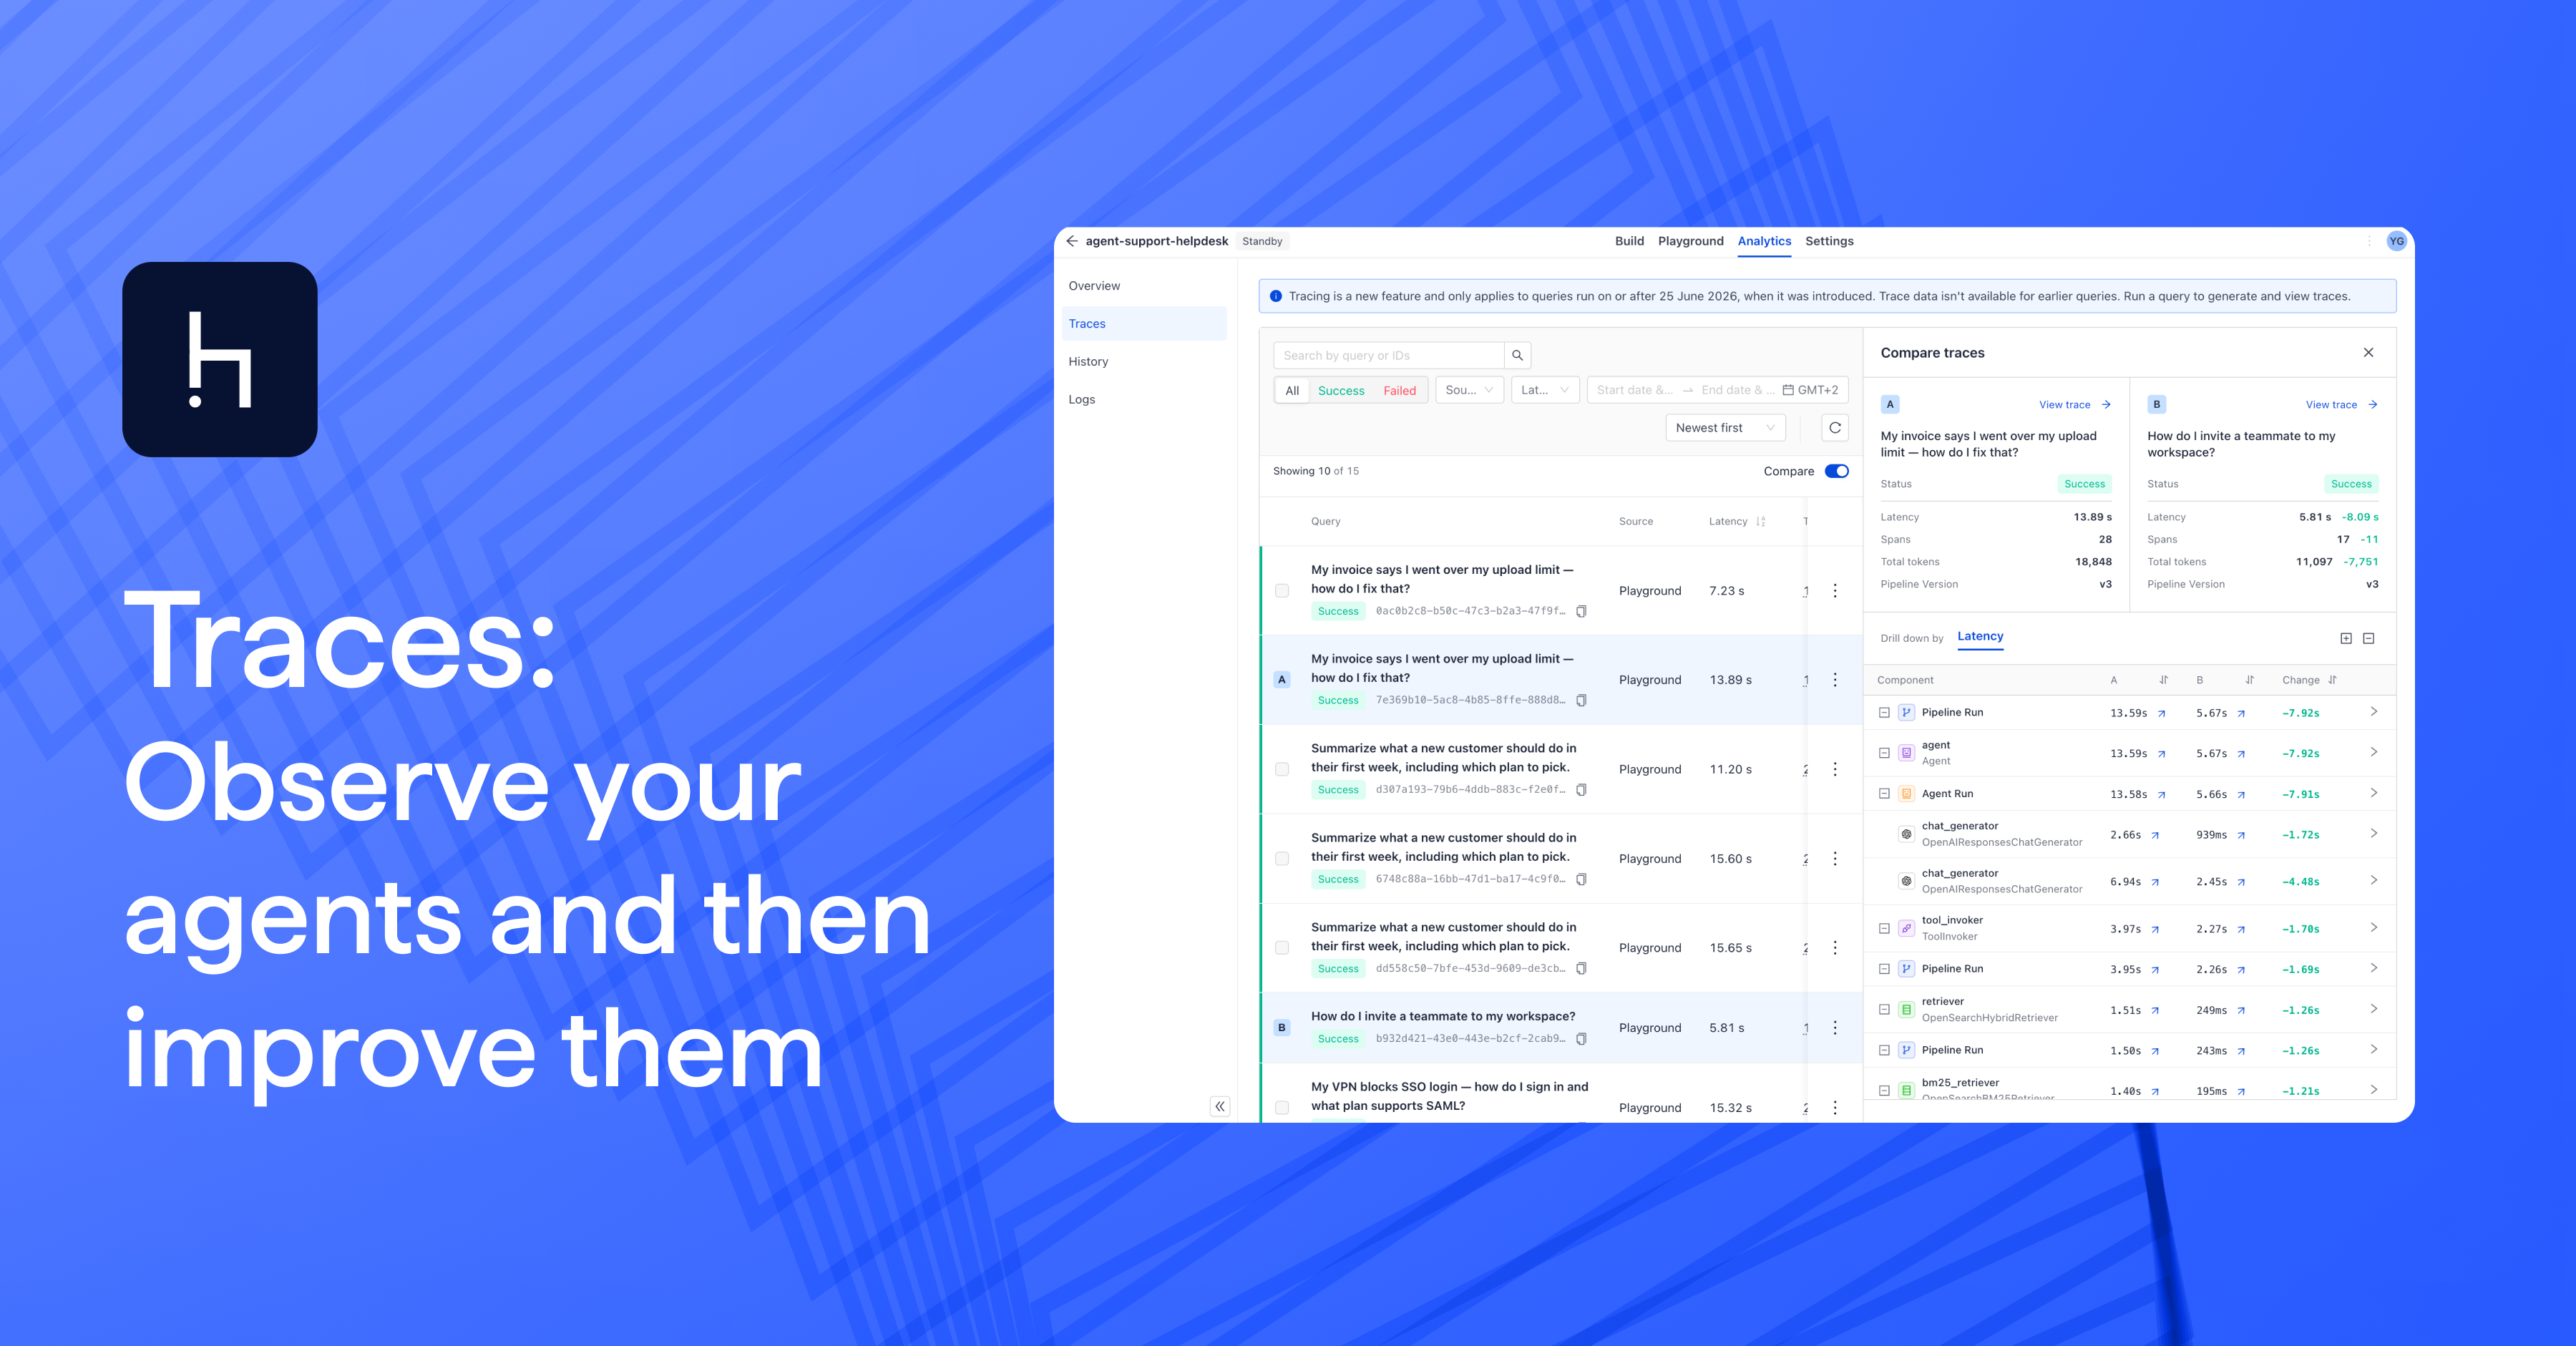
Traces gives you that visibility without adding a separate observability tool to your stack. In Haystack Enterprise Platform, your agents and everything else you build run as pipelines. Now with Traces, every run is captured end to end: spans, tokens, inputs, outputs, logs, and errors. And it all stays on the same infrastructure that your agents are already running on.
What a trace is
A trace is the complete execution record of one pipeline run: the full lifecycle of a single request, from the input that triggered it to the response it returned. Open a deployed pipeline, click the Traces tab. Every run is there by default without you having to set anything up.
Each trace in Haystack Enterprise Platform captures:
Find the run that matters in seconds
The Traces list shows every run with its query, source, latency, total tokens, and date/time. Filter to failures to triage what broke. Sort by latency to investigate lags. Search by trace ID when a customer sends you one, or by input text when you half-remember. Narrow by source or date range to scope to a release window or specific day.
Understand what happened, and why
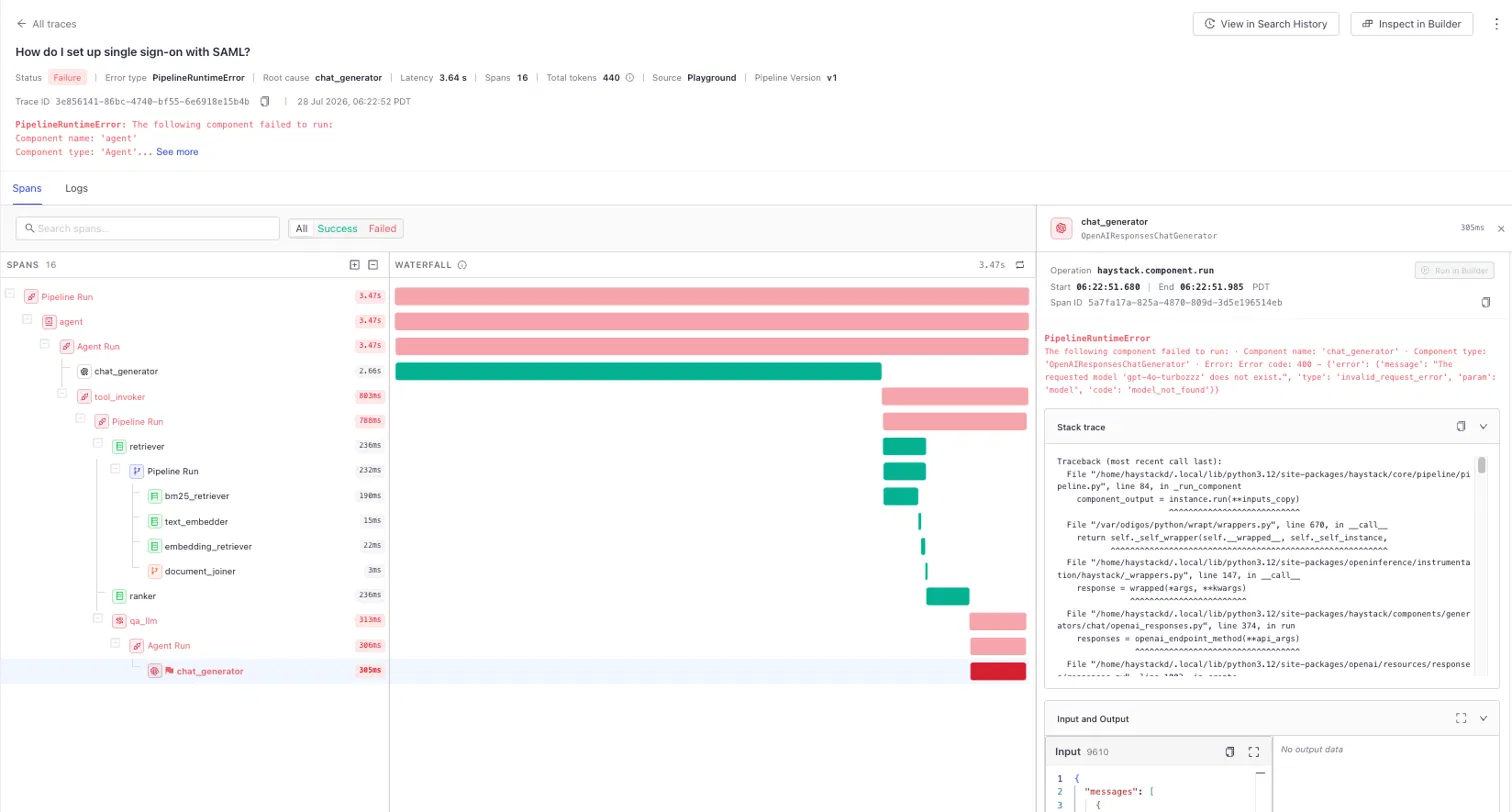
Every run is captured as an interactive waterfall. The full execution is laid out step by step, so you can see what happened at a glance and drill into any component for its real inputs, outputs, and logs to understand:
- Which components drove latency and token consumption: when an agent uses multiple models you can see where the time and cost went in one consistent view.
- Why a run failed: the trace names the root-cause component and tells you whether it's a configuration error you need to fix, or an external provider or infrastructure error that just needs a rerun.
From trace to fix
Find a span worth digging into and click Run in Builder. It opens that component in the pipeline's draft, pre-filled with the exact input from the trace so you can reproduce the behavior and test a fix immediately, instead of piecing the case back together by hand.
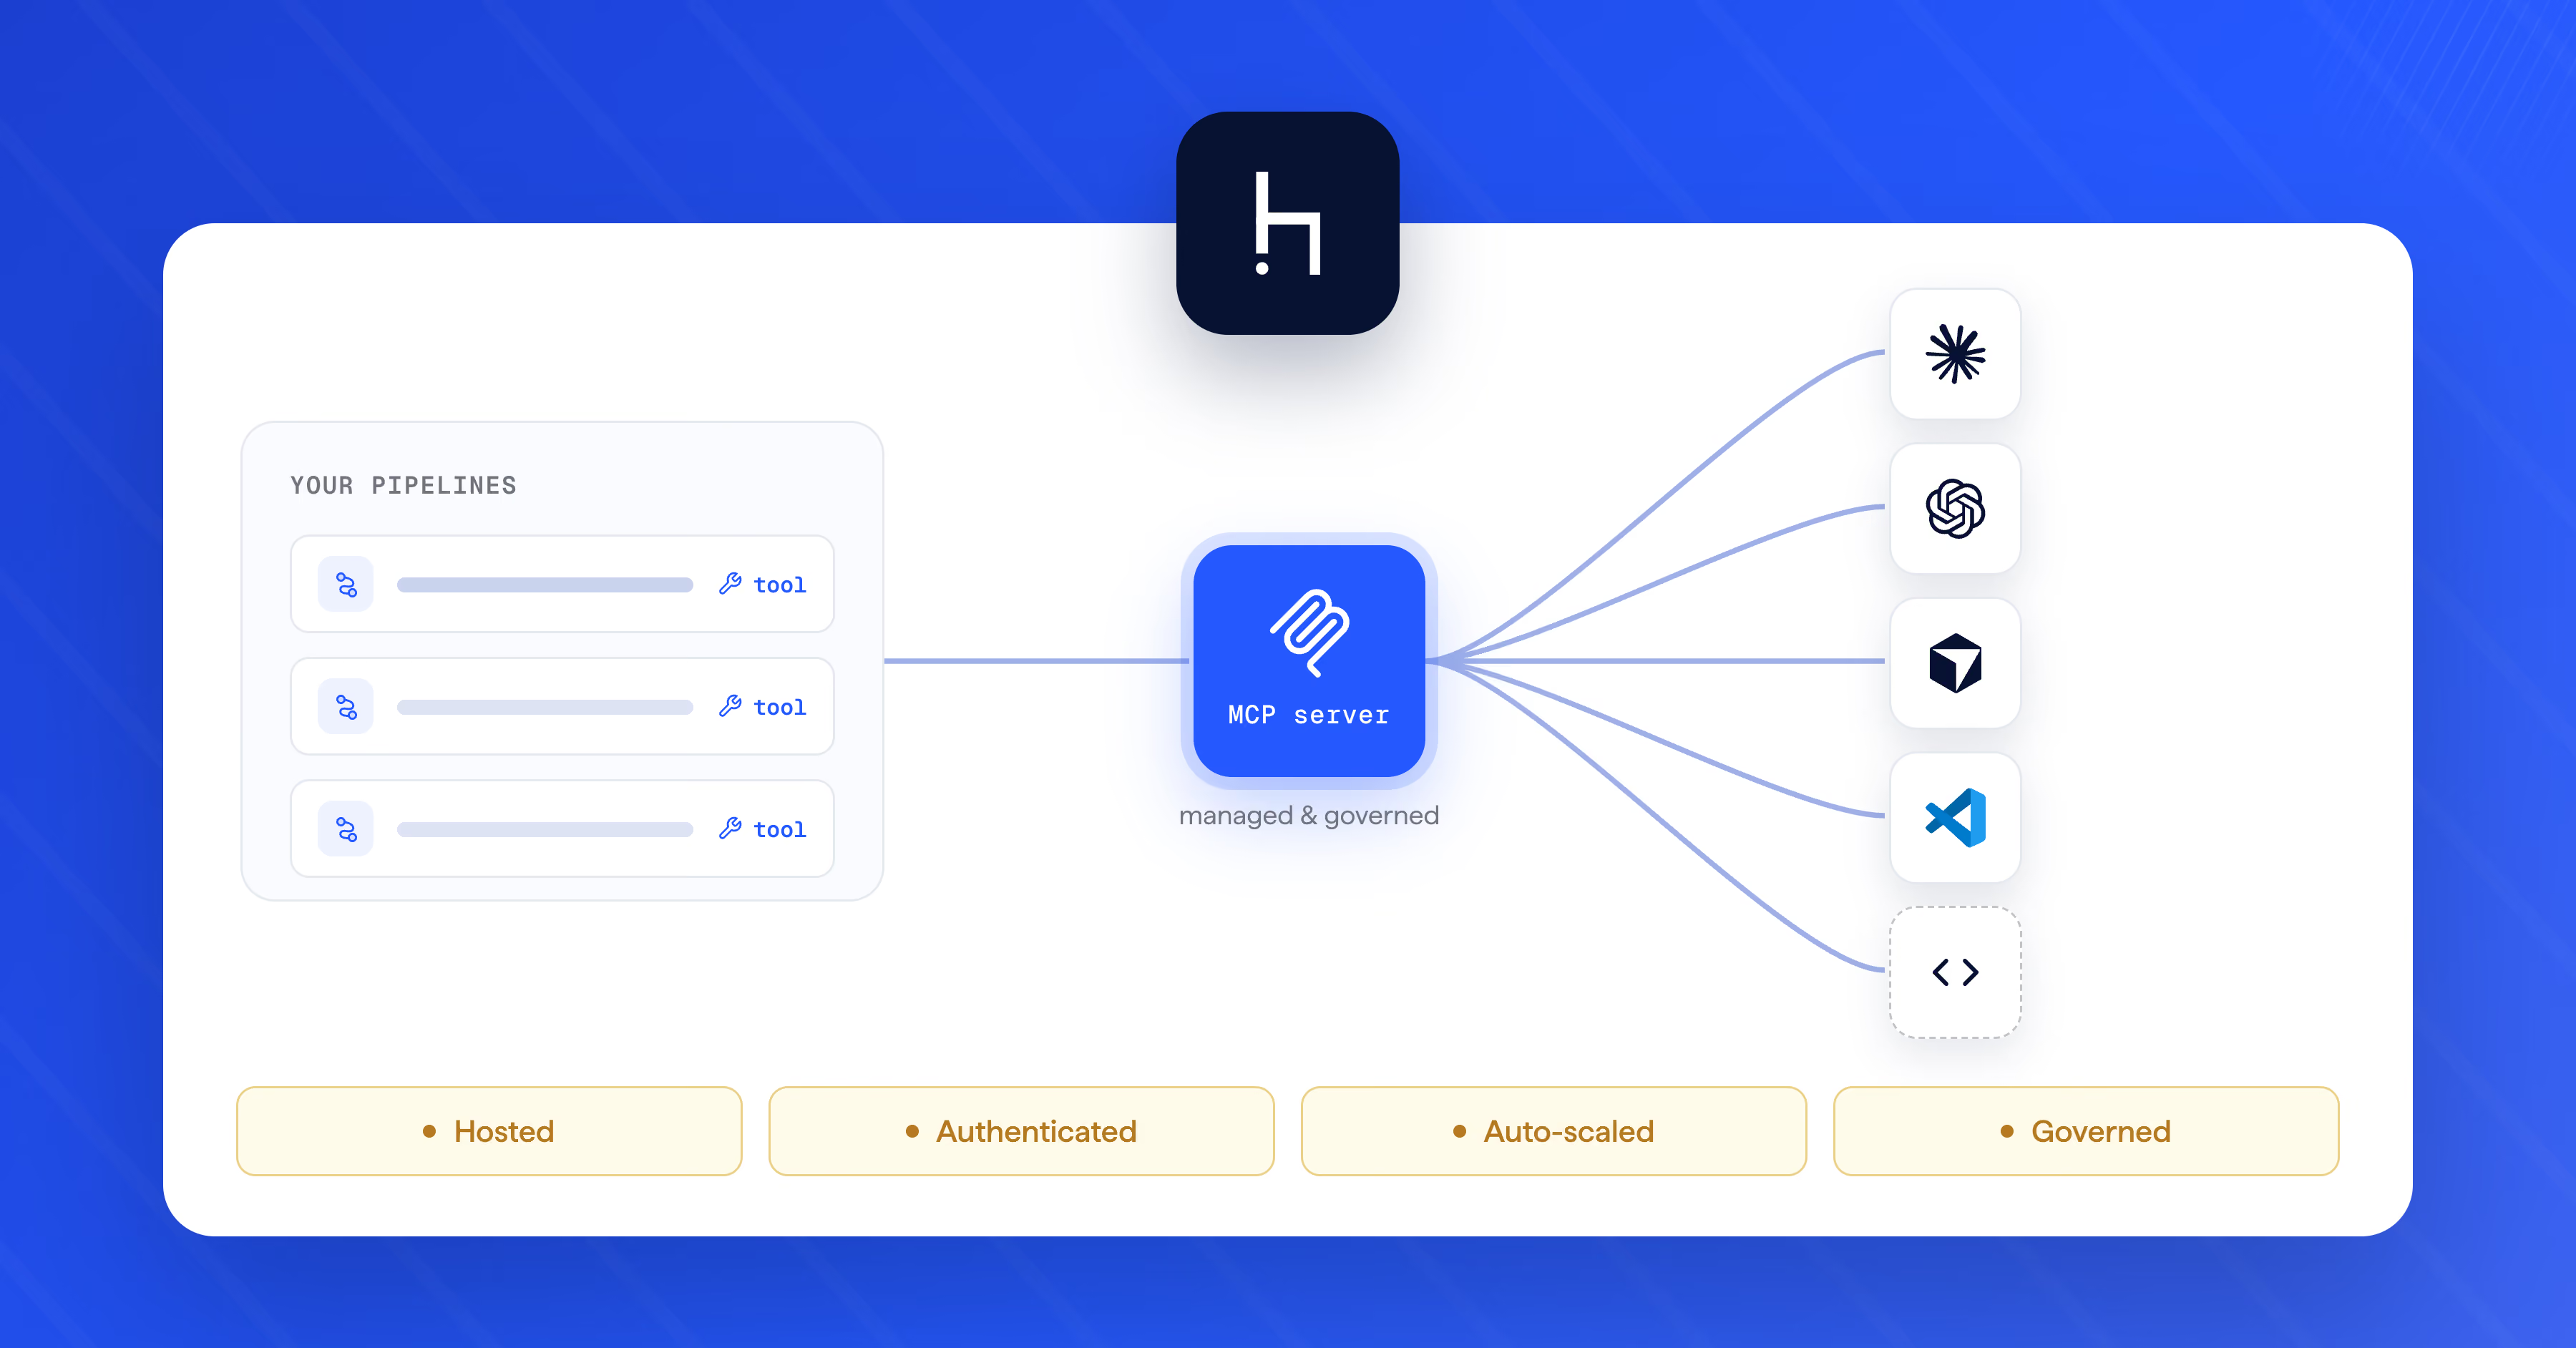
Debugging from your IDE, or sifting through dozens of runs at once? Point a coding agent at your traces through the Haystack Enterprise Platform MCP server [link] and let it read across them at scale.
Weigh a change before you commit to it
Every change to a pipeline is a bet. A different model, a reworked prompt, a new tool or retrieval strategy. Each tweak could make your output better while changing what the pipeline costs to run and how it behaves.
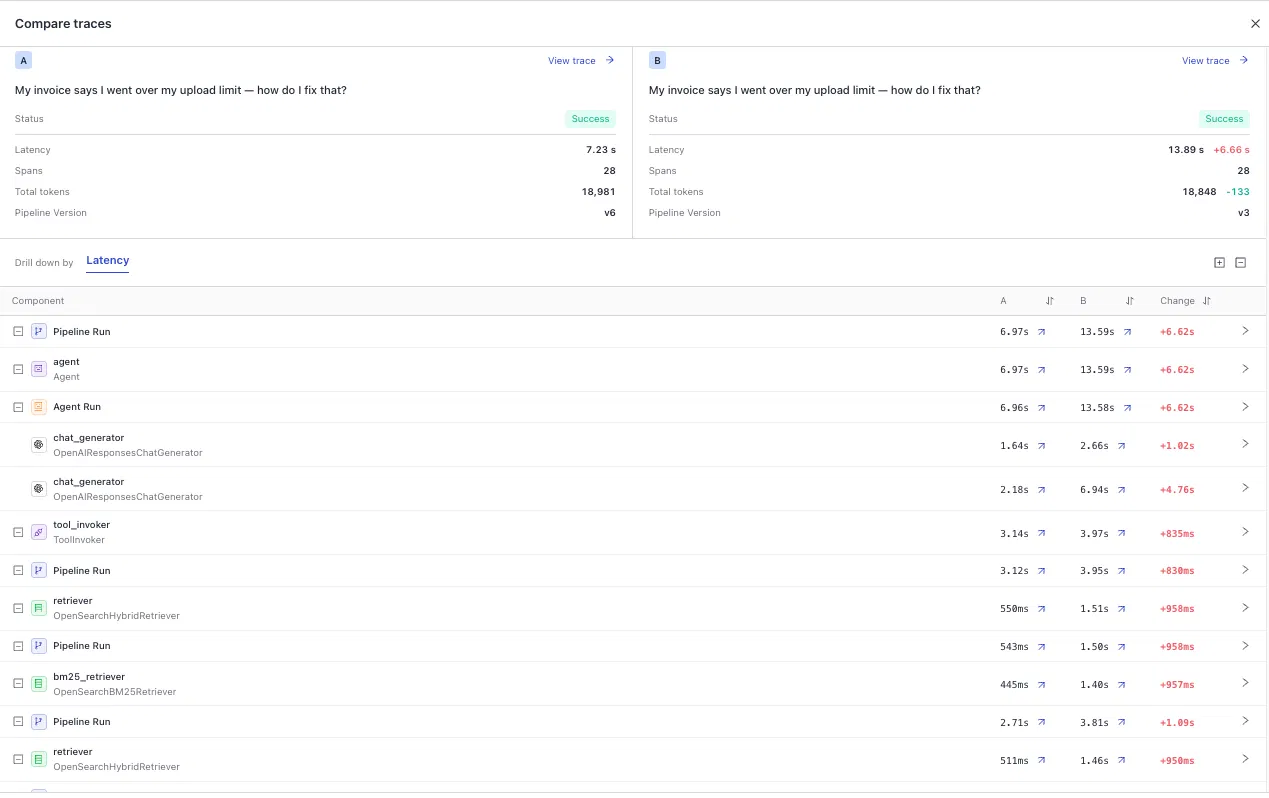
With Traces you can compare two versions of a pipeline and see exactly what a change did: how it moved latency and token consumption, and how it changed the answer itself – the two outputs shown side by side, differences highlighted, at each component. Instead of "the new version seems slower," you see which step slowed down, by how much, and precisely how its output changed.
Say you've swapped in a larger generation model hoping for better answers. Compare shows you what it cost: the generation step added latency and tokens, while the rest of the pipeline held steady. Whether the answer got better is up to your judgment, but now you're weighing a real improvement against a real cost, not guessing at both.
The same comparison can surface regressions you didn't intend. Run the same input against a past version and the current one, and a component that slowed down or started returning something different shows up before your users feel it.
Keep your data secure
Traces are stored on deepset-owned infrastructure, not shipped to an outside tool. Access is scoped to each workspace with role-based controls, data is encrypted at rest, and you can export any trace as JSON whenever you want it. The most sensitive data your agents touch stays inside the platform you’ve already audited.
Available now
Traces is live in Haystack Enterprise Platform. Deploy a new pipeline or redeploy an existing pipeline and it starts generating traces automatically.
Check out our documentation to learn more.
New to the platform? Book a demo to see Traces with your use case.
Curious about building AI Apps and Agents?
meet the author


Table of Contents

.png)